Introduction
Oracle APEX offers a variety of native Oracle JET integrations which are easy to use and setup. One of the most used integrations is the JET Chart. Another, less known fact is, that JET also offers a variety of JET components, that are not jet supported natively in APEX, but can be implemented manually.
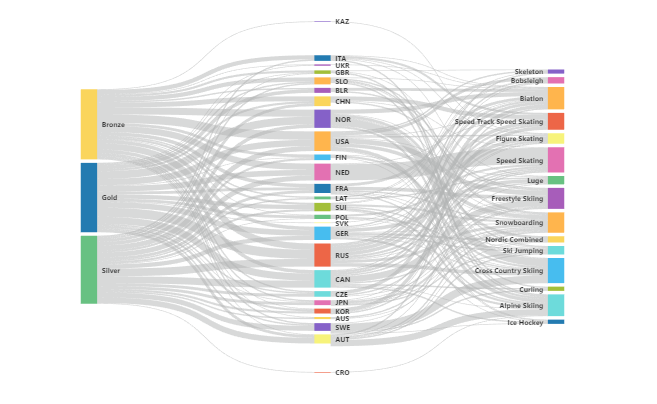
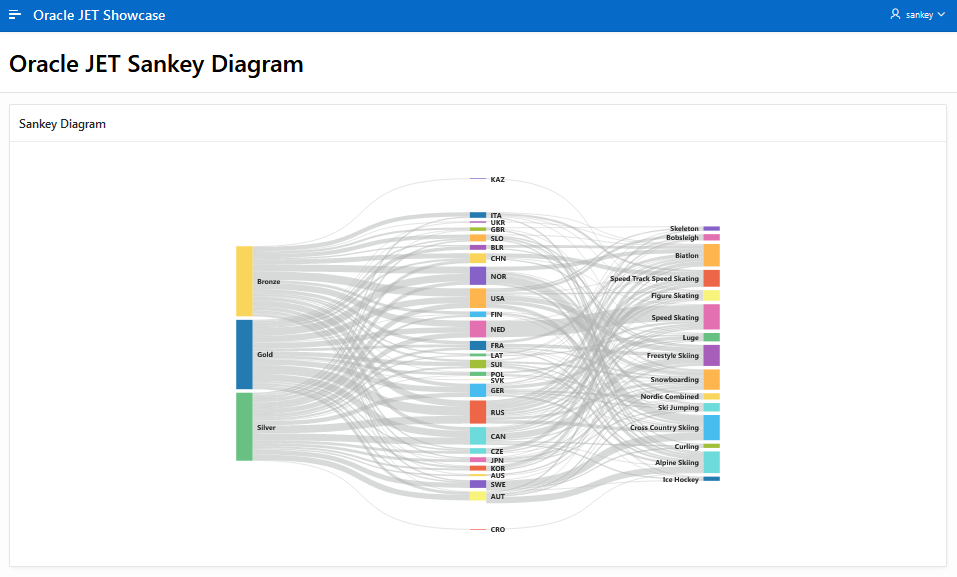
For this example, I will be using the Oracle JET Diagram to display data in Sankey Form.
A Sample Application with the Sankey diagram can be found here:
https://apex.oracle.com/pls/apex/r/jpdev/oracle-jet-showcase
Further all neccessary files can be found in the Github repository:
https://github.com/jonasdavidpenner/oracle-jet-showcase
All available JET components can be found in the Oracle JET Cookbook.
https://www.oracle.com/webfolder/technetwork/jet/jetCookbook.html
The Oracle JET Cookbook offers examples and different use cases for all available JET components.
We will be using version 12.1 of Oracle JET.
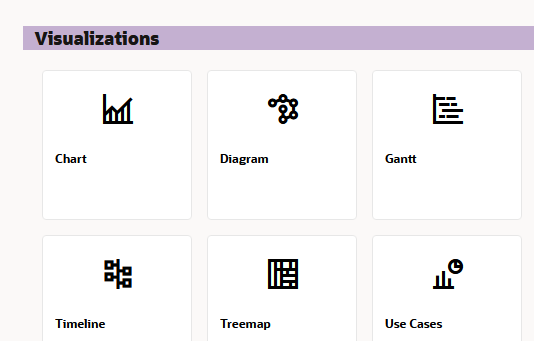
We will be focusing on the diagram component which can be found under the visualization category.
Implementing the JET Cookbook Usecase
All the necessary files are listed in the file explorer at the bottom of the page.
To implement the example Sankey into Oracle APEX the provided JavaScript and HTML Files have to be modified.
The neccessary files are:
- main.js
- demo.js
- DemoSankeyLayout.js
- DemoLayoutSupport.js
- demo.html
- sochiOlympics.json
Download the DemoSankyLayout.js, DemoLayoutSupport.js and sochiOlympics.json file from the Oracle JET Cookbook website and upload them to the static files of your Oracle Apex Application. These files will be referenced in the demo.js file and don’t have to be changed.
The Code for the changed main.js and demo.js are listed below
main.js
/*
   * main.js
   * To change this license header, choose License Headers in Project Properties.
   * To change this template file, choose Tools | Templates
   * and open the template in the editor.
   */

  function _getCDNPath(paths) {
    var cdnPath = 'https://static.oracle.com/cdn/jet/12.1.0';
    var ojPath = '/default/js/';
    var thirdpartyPath = '/3rdparty/';
    var keys = Object.keys(paths);
    var newPaths = {};
    function _isoj(key) {
      return (key.indexOf('oj') === 0 && key !== 'ojdnd');
    }
    keys.forEach(function (key) {
      newPaths[key] = cdnPath + (_isoj(key) ? ojPath : thirdpartyPath) + paths[key];
    });
    return newPaths;
  }


  require.config({
    paths: _getCDNPath({
      ojs: 'min',
      ojL10n: 'ojL10n',
      ojtranslations: 'resources',

    knockout: 'knockout/knockout-3.5.1',
    jquery: 'jquery/jquery-3.6.0.min',
    'jqueryui-amd': 'jquery/jqueryui-amd-1.13.0.min',
    text: 'require/text',
    hammerjs: 'hammer/hammer-2.0.8.min',
    signals: 'js-signals/signals.min',
    ojdnd: 'dnd-polyfill/dnd-polyfill-1.0.2.min',
    css: 'require-css/css.min',
    'css-builder': 'require-css/css-builder',
    normalize: 'require-css/normalize',
    preact: 'preact/dist/preact.umd',
    'preact/hooks': 'preact/hooks/dist/hooks.umd',
    'preact/compat': 'preact/compat/dist/compat.umd',
    proj4: 'proj4js/dist/proj4',
    touchr: 'touchr/touchr',
      chai: 'chai/chai-4.3.4.min'
    })
  });

  requirejs.config({
    //baseUrl: '../js',
      // Path mappings for the logical module names
    paths: {
        'DemoLayoutSupport':'#APP_IMAGES#DemoLayoutSupport'
    },
      // Shim configurations for modules that do not expose AMD
    shim: {
      jquery: {
        exports: ['jQuery', '$']
      },
      maps: {
        deps: ['jquery', 'i18n'],
      }
    },
      // This section configures the i18n plugin. It is merging the Oracle JET built-in translation
      // resources with a custom translation file.
      // Any resource file added, must be placed under a directory named "nls". You can use a path mapping or you can define
      // a path that is relative to the location of this main.js file.
    config: {
      ojL10n: {
        merge: {
                  // 'ojtranslations/nls/ojtranslations': 'resources/nls/menu'
        }
      }
    }
  });
demo.js
/*
* demo.js
*/
require(["require", "exports", "knockout", '#APP_IMAGES#DemoSankeyLayout', "ojs/ojbootstrap", 'text!#APP_IMAGES#sochiOlympics.json', "ojs/ojarraydataprovider", "ojs/ojattributegrouphandler", "ojs/ojknockout", "ojs/ojdiagram"], function (require, exports, ko, layout, ojbootstrap_1, jsonData, ArrayDataProvider, ojattributegrouphandler_1) {
      "use strict";

      class DiagramModel {
          constructor() {
              this.nodes = [];
              this.links = [];
              this.colorHandler = new ojattributegrouphandler_1.ColorAttributeGroupHandler();
              this.nodesMap = {};
              this.updateNodesWeight = (link) => {
                  const s = link.source, t = link.target;
                  if (s === 'Gold' || s === 'Silver' || s === 'Bronze')
                      this.nodesMap[s]['weight'] = this.nodesMap[s]['weight']
                          ? this.nodesMap[s]['weight'] + link['items']
                          : link['items'];
                  this.nodesMap[t]['weight'] = this.nodesMap[t]['weight']
                      ? this.nodesMap[t]['weight'] + link.items
                      : link.items;
              };
              this.data = JSON.parse(jsonData);
              this.createNode = (o) => {
                  const id = o['id'];
                  const weight = this.nodesMap[id]['weight'];
                  return {
                      id: id,
                      label: id,
                      shortDesc: o['name'],
                      icon: { color: this.colorHandler.getValue(id), height: weight * 3 }
                  };
              };
              this.layoutFunc = layout.layout;
              this.nodeDataProvider = new ArrayDataProvider(this.nodes, {
                  keyAttributes: 'id'
              });
              this.linkDataProvider = new ArrayDataProvider(this.links, {
                  keyAttributes: 'id'
              });
              this.styleDefaults = {
                  nodeDefaults: {
                      labelStyle: { fontSize: '30px', fontWeight: 'bold' },
                      icon: { width: 70, shape: 'rectangle' }
                  },
                  linkDefaults: { svgStyle: { strokeOpacity: 0.5, vectorEffect: 'none' } }
              };
              for (let i = 0; i < this.data.nodes.length; i++) {
                  this.nodesMap[this.data.nodes[i]['id']] = this.data.nodes[i];
              }
              for (let i = 0; i < this.data.links.length; i++) {
                  this.links.push(this.createLink(this.data.links[i]));
              }
              for (let nodeId in this.nodesMap) {
                  this.nodes.push(this.createNode(this.nodesMap[nodeId]));
              }
          }
          createLink(o) {
              this.updateNodesWeight(o);
              const source = o.source, target = o.target;
              return {
                  id: o.id,
                  startNode: source,
                  endNode: target,
                  width: o.items * 3,
                  shortDesc: this.nodesMap[source]['category'] === 'award'
                      ? o.items + ' ' + source + ' medals for ' + this.nodesMap[target]['name']
                      : this.nodesMap[source]['name'] +
                          ' won ' +
                          o['items'] +
                          ' medals in ' +
                          this.nodesMap[target]['name']
              };
          }
      }
      ojbootstrap_1.whenDocumentReady().then(() => {
          ko.applyBindings(new DiagramModel(), document.getElementById('diagram-container'));
      });
  });
Add main.js to ‘Function and Global Variable Declaration’.
Add demo.js to ‘Execute when Page Loads’.
Require.js is necessary for the code to work. Using the File-URL Section require.js can be imported from the Oracle CDN.
https://static.oracle.com/cdn/jet/12.1.0/3rdparty/require/require.jsAdd the custom CSS file
#JET_CSS_DIRECTORY#alta/oj-alta-notag-min.css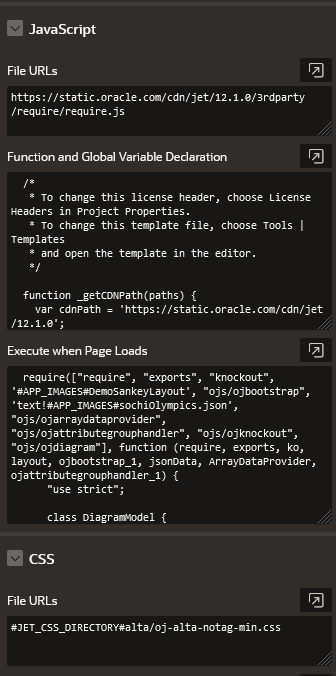
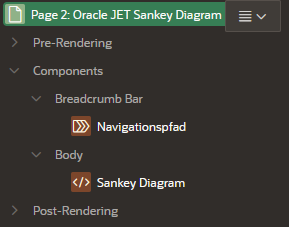
Add the HTML Code to a Static Content Region to the Region Body of the Page.
<div id="sampleDemo" class="demo-padding demo-container">
        <div id="componentDemoContent">

          <div id='diagram-container'>
            <oj-diagram id='diagram1'
              node-data = '[[nodeDataProvider]]'
              link-data = '[[linkDataProvider]]'
              layout = '[[layoutFunc]]'
              style-defaults = '[[styleDefaults]]'
              class='demo-diagram-sankeylayout-height-style'>
            </oj-diagram>
          </div>
        </div>
      </div>
After loading the Page the Sankey Diagram will be rendered in the Static Content Region
Creating a dynamic sankey diagram
For the Sankey to be useful in applications, it is necessary to not pull the data from a static JSON file. For this, the data source of the Sankey must be adapted.
Two Row Sankey
To make the diagram dynamic, the JSON file must be replaced with a page item that contains the data in JSON format.
Through a SQL query that returns a JSON object, the data can be represented as a JSON structure.
The JSON consists of nodes and links, where each node must have at least one link. Otherwise the diagram will not be displayed correctly.
Example JSON:
{
    "nodes" : [
      {"id":"node0", "name": "node0", "category":"region"},
      {"id":"node1", "name": "node1", "category":"region"},
      {"id":"node2", "name": "node2", "category":"region"},
      {"id":"node3", "name": "node2", "category":"region"}
    ],
    "links": [
      {"id":"L1", "source": "node0", "target": "node1", "items" : 15},
      {"id":"L2", "source": "node0", "target": "node2", "items" : 20},
      {"id":"L3", "source": "node1", "target": "node2", "items" : 16},
      {"id":"L4", "source": "node1", "target": "node3", "items" : 20}
    ]
  }
I use a sample dataset from Maven Analytics as the data for the Dynamic Charts. Maven Analytics provides a wide range of sample datasets as a data playground.
https://www.mavenanalytics.io/data-playground
For this example, I chose to use the Unicorn Companies dataset, which contains private companies with a value of more than one billion dollars.
This data was imported into the database and stored in the table ‘unicorn_companies’.
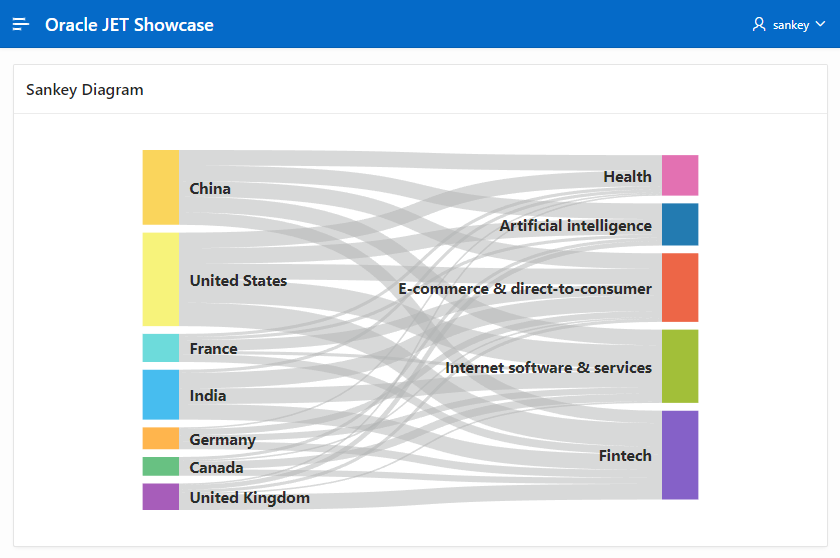
For the first diagram, a Sankey is to be created that shows the top 5 industries of the Unicorn Companies and their distribution among the top 7 countries with the most Unicorn Companies.
In order to load the data for the sankey from the database, a process must be created that loads the JSON structure into the page item during the pageload.
The following code is required for this
sankeydata.sql
--Get top 5 industries
WITH ind as
(select Industry, count(*) as companies
from unicorn_companies
group by industry
order by 2 desc
fetch first 5 rows only
), co as
(
    select country, count(*)
    from unicorn_companies
    where industry in (select industry from ind)
    group by country
    order by 2 desc
    fetch first 7 rows only
)
select JSON_OBJECT(
    KEY 'nodes' VALUE (
        select JSON_ARRAYAGG(
            json_object(
                KEY 'id' value id,
                KEY 'name' value id,
                KEY 'category' value category
                returning clob
            )returning clob
        )from (

            (select industry id, 'industry' category from ind)
            UNION
            (select country id, 'country' category from co)

        )
    ),
    KEY 'links' value (
        select JSON_ARRAYAGG(
            json_object(
                KEY 'ID' value CONCAT('L',TO_CHAR(ROWNUM)),
                KEY 'source' value origin,
                KEY 'target' value target,
                KEY 'items' value count_normalized,
                KEY 'count' value count
                returning clob
            )returning clob
        ) from (with g as (

       select country origin,
            industry target,
            CASE
                                        WHEN count(*) > 1000 THEN 20
                                        WHEN count(*) between 101 and 1000 THEN 15
                                        WHEN count(*) between 11 and 100 then 10
                                        when count(*) between 1 and 10 then count(*)
            END count_normalized,
            count(*) count
        from unicorn_companies
        where industry in (select industry from ind)
        and country in (select country from co)
        group by country, industry
        order by 3 desc
        )

            select rownum, g.* from g)
    )returning clob
) AS JSON
into :P3_JSON_SANKEY
FROM DUAL;
In order for the diagram to get its data from the database and the page item from now on, the data source in the demo.js file must be adjusted. The JSON in the static files is replaced by the page item.
demo.js
function loadSankey(){
  require(["require", "exports", "knockout", '#APP_IMAGES#DemoSankeyLayout', "ojs/ojbootstrap", "ojs/ojarraydataprovider", "ojs/ojattributegrouphandler", "ojs/ojknockout", "ojs/ojdiagram"], function (require, exports, ko, layout, ojbootstrap_1, ArrayDataProvider, ojattributegrouphandler_1) {
      "use strict";

      class DiagramModel {
          constructor() {
              this.nodes = [];
              this.links = [];
              this.colorHandler = new ojattributegrouphandler_1.ColorAttributeGroupHandler();
              this.nodesMap = {};
              this.data = JSON.parse($v("P3_JSON_SANKEY"));
              console.log(this.data);
              this.updateNodesWeight = (link) => {
                  const s = link.source, t = link.target;
                  if (s === this.data.nodes[0].id || s === this.data.nodes[1].id || s === this.data.nodes[2].id || s === this.data.nodes[3].id  || s === this.data.nodes[4].id || s === this.data.nodes[5].id || s === this.data.nodes[6].id || s === this.data.nodes[7].id || s === this.data.nodes[8].id || s === this.data.nodes[9].id || s === this.data.nodes[10].id
                  || s === this.data.nodes[11].id || s === this.data.nodes[11].id || s === this.data.nodes[12].id)
                      this.nodesMap[s]['weight'] = this.nodesMap[s]['weight']
                          ? this.nodesMap[s]['weight'] + link['items']
                          : link['items'];
                  this.nodesMap[t]['weight'] = this.nodesMap[t]['weight']
                      ? this.nodesMap[t]['weight'] + link.items
                      : link.items;
              };
              this.createNode = (o) => {
                  const id = o['id'];
                  const weight = this.nodesMap[id]['weight'];
                  return {
                      id: id,
                      label: id,
                      shortDesc: o['name'],
                      icon: { color: this.colorHandler.getValue(id), height: weight * 3 }
                  };
              };
              this.layoutFunc = layout.layout;
              this.nodeDataProvider = new ArrayDataProvider(this.nodes, {
                  keyAttributes: 'id'
              });
              this.linkDataProvider = new ArrayDataProvider(this.links, {
                  keyAttributes: 'id'
              });
              this.styleDefaults = {
                  nodeDefaults: {
                      labelStyle: { fontSize: '30px', fontWeight: 'bold' },
                      icon: { width: 70, shape: 'rectangle' }
                  },
                  linkDefaults: { svgStyle: { strokeOpacity: 0.5, vectorEffect: 'none' } }
              };
              for (let i = 0; i < this.data.nodes.length; i++) {
                  this.nodesMap[this.data.nodes[i]['id']] = this.data.nodes[i];
              }
              for (let i = 0; i < this.data.links.length; i++) {
                  this.links.push(this.createLink(this.data.links[i]));
              }
              for (let nodeId in this.nodesMap) {
                  this.nodes.push(this.createNode(this.nodesMap[nodeId]));
              }
          }
          createLink(o) {
              this.updateNodesWeight(o);
              const source = o.source, target = o.target;
              return {
                  id: o.id,
                  startNode: source,
                  endNode: target,
                  width: o.items * 3,
                  shortDesc: this.nodesMap[source]['category'] === 'country'
                      ? o.items + ' ' + source + ' companies ' + this.nodesMap[target]['name']
                      : this.nodesMap[source]['name'] +
                          ' has ' +
                          o['count'] +
                          ' companies in ' +
                          this.nodesMap[target]['name']
              };
          }
      }
      ojbootstrap_1.whenDocumentReady().then(() => {
          ko.applyBindings(new DiagramModel(), document.getElementById('diagram-container'));
      });
  });
}

loadSankey();
After the changes have been made, our Dynamic Sankey will be displayed instead of the Sochi Olympic Sankey.
Three Row Sankey
The Sankey can be displayed with any number of columns. As in the Olympic example, it is also possible to display data in three columns.
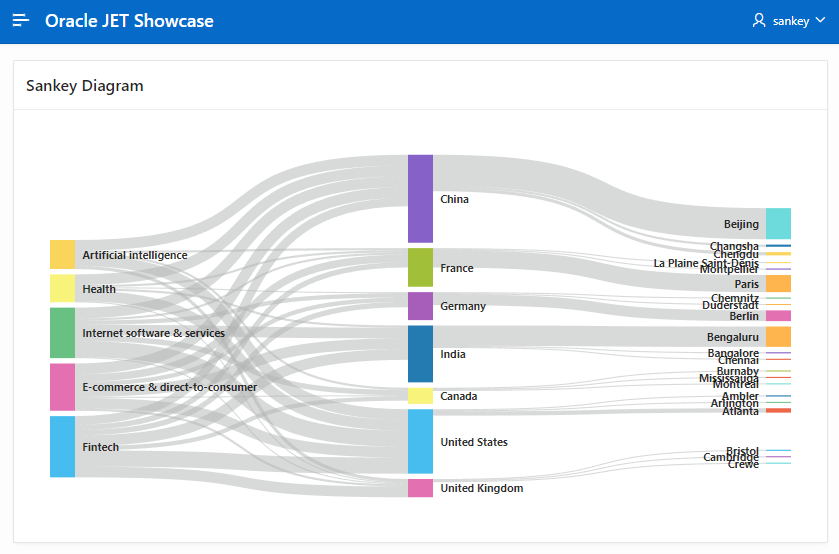
In the case of our example of Unicorn Companies, the third column could be, for example, cities from the corresponding countries.
For this only the SQL must be adapted
sankeydata.sql
--Get top 5 industries
WITH ind as
(select Industry, count(*) as companies
from unicorn_companies
group by industry
order by 2 desc
fetch first 5 rows only
), co as
(
    select country, count(*)
    from unicorn_companies
    where industry in (select industry from ind)
    group by country
    order by 2 desc
    fetch first 7 rows only
)
select JSON_OBJECT(
    KEY 'nodes' VALUE (
        select JSON_ARRAYAGG(
            json_object(
                KEY 'id' value id,
                KEY 'name' value id,
                KEY 'category' value category
                returning clob
            )returning clob
        )from (

            (select industry id, 'industry' category from ind)
            UNION
            (select country id, 'country' category from co)
            UNION
            (
                select  city id, 'city' category
            from (select city, country, count(*) count,
                rank() over (partition by country order by city) rank
               from unicorn_companies
                where industry in (select industry from ind)
        and country in (select country from co)
        group by country, city)
        where rank <= 3
            )

        )
    ),
    KEY 'links' value (
        select JSON_ARRAYAGG(
            json_object(
                KEY 'ID' value CONCAT('L',TO_CHAR(ROWNUM)),
                KEY 'source' value origin,
                KEY 'target' value target,
                KEY 'items' value count_normalized,
                KEY 'count' value count
                returning clob
            )returning clob
        ) from (with g as (

       select country target,
            industry origin,
             CASE
                                        WHEN count(*) > 1000 THEN 20
                                        WHEN count(*) between 101 and 1000 THEN 15
                                        WHEN count(*) between 11 and 100 then 10
                                        when count(*) between 1 and 10 then count(*)
            END count_normalized,
            count(*) count
        from unicorn_companies
        where industry in (select industry from ind)
        and country in (select country from co)
        group by country, industry

         union

        select  city target,country origin, count count,
        5 as count_normalized
            from (select city, country, count(*) count,
                rank() over (partition by country order by city) rank
               from unicorn_companies
                where industry in (select industry from ind)
        and country in (select country from co)
        group by country, city)
        where rank <= 3
        )

            select rownum, g.* from g)
    )returning clob
) AS JSON
into :P4_JSON_SANKEY
FROM DUAL;
The demo.js file also needs to be modified to display the larger number of nodes.
function loadSankey(){
    require(["require", "exports", "knockout", '#APP_IMAGES#DemoSankeyLayout', "ojs/ojbootstrap", "ojs/ojarraydataprovider", "ojs/ojattributegrouphandler", "ojs/ojknockout", "ojs/ojdiagram"], function (require, exports, ko, layout, ojbootstrap_1, ArrayDataProvider, ojattributegrouphandler_1) {
        "use strict";

        class DiagramModel {
            constructor() {
                this.nodes = [];
                this.links = [];
                this.colorHandler = new ojattributegrouphandler_1.ColorAttributeGroupHandler();
                this.nodesMap = {};
                this.data = JSON.parse($v("P4_JSON_SANKEY"));
                console.log(this.data);
                this.updateNodesWeight = (link) => {
                    const s = link.source, t = link.target;
                    if (s === this.data.nodes[0].id || s === this.data.nodes[1].id || s === this.data.nodes[2].id || s === this.data.nodes[3].id  || s === this.data.nodes[4].id || s === this.data.nodes[5].id || s === this.data.nodes[6].id || s === this.data.nodes[7].id || s === this.data.nodes[8].id || s === this.data.nodes[9].id || s === this.data.nodes[10].id
                    || s === this.data.nodes[11].id || s === this.data.nodes[11].id || s === this.data.nodes[12].id || s === this.data.nodes[13].id || s === this.data.nodes[14].id || s === this.data.nodes[15].id  || s === this.data.nodes[16].id || s === this.data.nodes[17].id || s === this.data.nodes[18].id || s === this.data.nodes[19].id || s === this.data.nodes[20].id || s === this.data.nodes[21].id || s === this.data.nodes[22].id
                    || s === this.data.nodes[23].id || s === this.data.nodes[24].id || s === this.data.nodes[25].id)
                        this.nodesMap[s]['weight'] = this.nodesMap[s]['weight']
                            ? this.nodesMap[s]['weight'] + link['items']
                            : link['items'];
                    this.nodesMap[t]['weight'] = this.nodesMap[t]['weight']
                        ? this.nodesMap[t]['weight'] + link.items
                        : link.items;
                };
                this.createNode = (o) => {
                    const id = o['id'];
                    const weight = this.nodesMap[id]['weight'];
                    return {
                        id: id,
                        label: id,
                        shortDesc: o['name'],
                        icon: { color: this.colorHandler.getValue(id), height: weight * 3 }
                    };
                };
                this.layoutFunc = layout.layout;
                this.nodeDataProvider = new ArrayDataProvider(this.nodes, {
                    keyAttributes: 'id'
                });
                this.linkDataProvider = new ArrayDataProvider(this.links, {
                    keyAttributes: 'id'
                });
                this.styleDefaults = {
                    nodeDefaults: {
                        labelStyle: { fontSize: '30px', fontWeight: 'bold' },
                        icon: { width: 70, shape: 'rectangle' }
                    },
                    linkDefaults: { svgStyle: { strokeOpacity: 0.5, vectorEffect: 'none' } }
                };
                for (let i = 0; i < this.data.nodes.length; i++) {
                    this.nodesMap[this.data.nodes[i]['id']] = this.data.nodes[i];
                }
                for (let i = 0; i < this.data.links.length; i++) {
                    this.links.push(this.createLink(this.data.links[i]));
                }
                for (let nodeId in this.nodesMap) {
                    this.nodes.push(this.createNode(this.nodesMap[nodeId]));
                }
            }
            createLink(o) {
                this.updateNodesWeight(o);
                const source = o.source, target = o.target;
                return {
                    id: o.id,
                    startNode: source,
                    endNode: target,
                    width: o.items * 3,
                    shortDesc: this.nodesMap[source]['category'] === 'country'
                        ? o.items + ' ' + source + ' companies ' + this.nodesMap[target]['name']
                        : this.nodesMap[source]['name'] +
                            ' has ' +
                            o['count'] +
                            ' companies in ' +
                            this.nodesMap[target]['name']
                };
            }
        }
        ojbootstrap_1.whenDocumentReady().then(() => {
            ko.applyBindings(new DiagramModel(), document.getElementById('diagram-container'));
        });
    });
  }

  loadSankey();
Notes on working with Sankey diagrams
- Each node must have at least one link. Otherwise there will be display errors
- To keep the diagram readable I recommend a case query in SQL that replaces the actual number of link items with ranges. The actual number can be displayed via the tooltip.
- In the JSON, the link ID must be L followed by numbers enumerated from 1. So for example “L1” or “L13”.
2 Responses
Hi Jonas, a pleasure to greet you from Argentina, my name is Hernan Quintero, I saw your post where you talk about “Working with JET Diagrams in Oracle Apex”, I followed step by step your recommendations but when I started my app is blank, I do not know where I can enter the JSON data from the cookbook, I think that’s why, can you help me, please?
Hello Hernan,
sorry for the late reply.
The JSON Data from the Cookbook has to be uploaded to the static files in you APEX workspace.
Hope this helps!